Customer sentiment tag correlation analysis identifies links between positive or negative sentiments in customer messages and business outcomes, helping CX teams pinpoint root causes of satisfaction or frustration and act to enhance customer experience.
Every CX leader knows feedback matters, but making sense of it can feel like drowning in noise. Complex, multichannel interactions only add to the confusion. You need to know, not guess, what is driving customer happiness or why problems repeat.
From my work with enterprise support teams, I see that the real issue isn’t collecting feedback — it’s connecting the dots between what customers feel and the outcomes you care about, like CSAT or escalations. Correlation analysis brings light to this gray area.
In this article, you will see exactly how sentiment tag correlation analysis reveals actionable links between customer emotions and business results, how to do it in practical terms, and how advanced platforms now automate and simplify the process.
What Is Customer Sentiment Tag Correlation Analysis?
Customer sentiment tag correlation analysis is the process of measuring how frequently specific customer experience tags appear alongside positive, negative, or neutral sentiment.
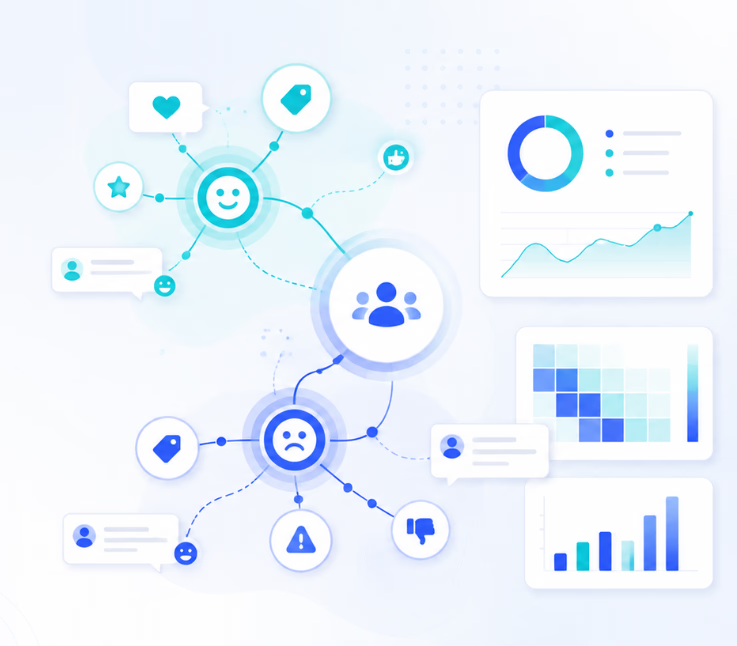
Instead of looking only at an overall sentiment score, correlation analysis connects customer emotions with the actual reasons behind them. For example, a company may discover that tags such as “fast resolution,” “helpful agent,” and “easy setup” are strongly associated with positive customer sentiment, while “long wait time,” “billing issue,” and “repeat contact” are more closely associated with negative sentiment.
This gives customer experience teams a clearer answer to an important question: What is actually driving customers to feel positively or negatively about their experience?
The analysis can be applied to customer support calls, live chats, emails, surveys, reviews, social media conversations, support tickets, and other forms of customer feedback.
How Customer Sentiment and Tags Work Together
Sentiment and tags measure two different parts of a customer interaction.
Sentiment represents how the customer feels. Depending on the system, conversations may be classified as positive, negative, or neutral, or assigned a more detailed sentiment score.
Tags describe what happened during the interaction. Common tags might include:
- Product quality
- Delivery delay
- Billing problem
- Agent professionalism
- Refund request
- Technical issue
- First-contact resolution
- Pricing concern
- Long hold time
- Product availability
Analyzing either dimension alone provides only part of the picture.
Suppose 23% of customer conversations contain negative sentiment. That number shows that dissatisfaction exists, but it does not explain why. If sentiment data is correlated with interaction tags, the company may discover that 48% of conversations tagged “billing problem” are negative compared with only 12% of conversations tagged “product information.”
That difference makes the data actionable.
How Customer Sentiment Tag Correlation Analysis Works
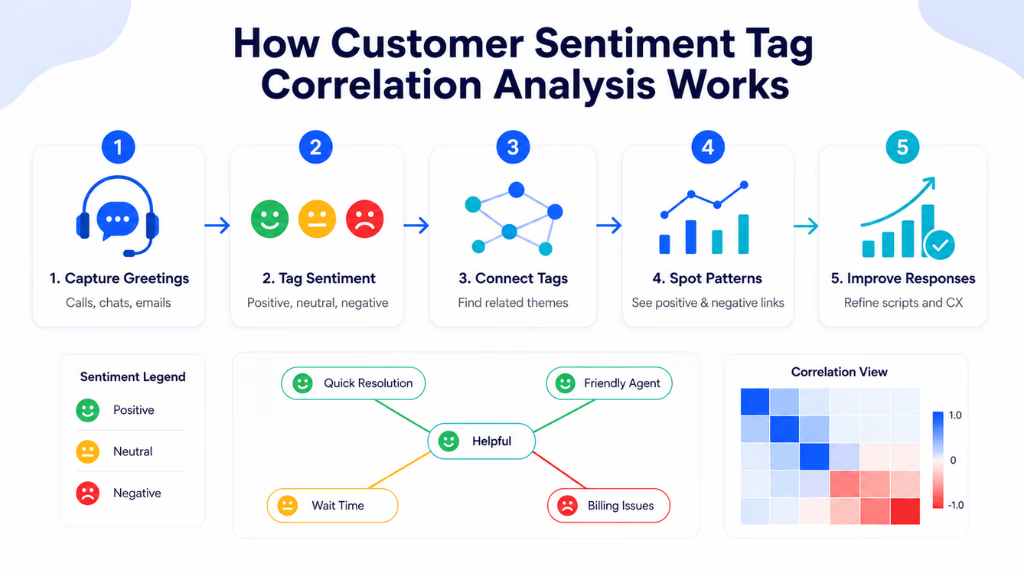
A useful correlation analysis begins by bringing together customer sentiment, conversation tags, and interaction metadata within the same dataset.
1. Collect Customer Interaction Data
The first step is collecting customer conversations from relevant channels, such as contact center calls, support tickets, chat transcripts, survey responses, reviews, and emails.
The larger and more representative the dataset, the easier it becomes to identify recurring associations rather than isolated incidents.
Important metadata can also be retained, including:
- Interaction date
- Customer segment
- Communication channel
- Agent or team
- Product or service
- Resolution status
- Call duration
- Customer journey stage
This information becomes useful when sentiment correlations need to be analyzed at a more detailed level.
2. Detect Customer Sentiment
Sentiment analysis technology evaluates the language used by the customer and classifies the emotional direction of the interaction.
At the simplest level, conversations can be divided into:
Positive sentiment: Satisfaction, appreciation, confidence, enthusiasm, or relief.
Negative sentiment: Frustration, disappointment, dissatisfaction, anger, or concern.
Neutral sentiment: Conversations where there is little evidence of either positive or negative emotion.
More advanced AI systems can analyze sentiment throughout the conversation rather than assigning a single label to the entire interaction. This makes it possible to identify situations where a frustrated customer becomes satisfied after receiving an effective solution.
3. Assign Relevant Interaction Tags
Tags are then applied to each conversation based on topics, events, behaviors, outcomes, or customer needs.
Tags can be manually created, rule-based, or automatically generated using AI and natural language processing.
For example, a support call could contain the following tags:
Billing issue → Long wait time → Escalation → Refund completed
The same interaction might begin with strongly negative sentiment and finish with neutral or positive sentiment.
Analyzing these tags alongside sentiment helps reveal which parts of the interaction contributed to the customer’s emotional response.
4. Measure Positive and Negative Associations
The next step is determining how strongly each tag is associated with a particular sentiment.
Imagine the following simplified dataset:
| Customer Experience Tag | Positive Sentiment | Negative Sentiment |
|---|---|---|
| Fast resolution | 74% | 9% |
| Helpful agent | 81% | 7% |
| Easy onboarding | 69% | 11% |
| Long hold time | 14% | 67% |
| Billing dispute | 18% | 61% |
| Repeat contact | 11% | 72% |
The pattern immediately highlights potential customer experience drivers.
Tags such as helpful agent and fast resolution have strong positive associations, while repeat contact and long hold time have much stronger relationships with customer dissatisfaction.
Teams can then prioritize operational improvements based on the strength and frequency of these associations.
Positive Sentiment Tag Associations
Positive tag associations reveal the experiences, behaviors, and outcomes that customers consistently appreciate.
Typical positive associations may include:
Fast Issue Resolution
Customers generally respond positively when their problem is resolved quickly without unnecessary transfers, repeated explanations, or follow-up conversations.
A strong positive relationship between fast resolution and customer sentiment may indicate that resolution speed is one of the organization’s most important customer experience drivers.
First-Contact Resolution
When customers receive an effective solution during their first interaction, satisfaction often improves.
If the first-contact resolution tag repeatedly appears in positive conversations, the organization has evidence that reducing repeat contacts could significantly improve overall customer experience.
Helpful or Empathetic Agents
Agent behavior can have a major influence on how customers perceive an interaction.
Tags related to agent helpfulness, clear explanations, empathy, and professional communication can be compared with sentiment data to identify the behaviors that contribute most strongly to positive experiences.
These findings can then influence coaching and quality assurance programs.
Simple Customer Journeys
Tags such as easy onboarding, simple checkout, self-service success, or quick verification can reveal whether customers value low-effort experiences.
A strong positive association may indicate that simplifying processes is just as important as improving the product itself.
Successful Problem Resolution
Customer sentiment can improve significantly when the final outcome meets the customer’s expectations.
For example, successful replacements, completed refunds, restored services, or resolved technical issues may have strong positive correlations even when the interaction began negatively.
This is especially useful when analyzing sentiment change during a conversation rather than relying solely on the opening sentiment.
Negative Sentiment Tag Associations
Negative associations help organizations identify recurring sources of friction and dissatisfaction.
Long Wait or Hold Times
Customers who wait too long before receiving help may become frustrated even if the eventual resolution is successful.
If the long hold time tag is repeatedly associated with negative sentiment, contact center leaders can investigate staffing levels, routing processes, peak-hour demand, or self-service alternatives.
Repeat Contacts
Customers generally do not want to contact a company several times about the same problem.
A strong relationship between repeat contact and negative sentiment can indicate problems with first-contact resolution, agent access to information, internal processes, or product reliability.
Billing and Pricing Problems
Billing disputes, unexpected charges, refund delays, and unclear pricing frequently create negative customer experiences.
Correlation analysis can reveal which specific billing tags generate the strongest negative reaction instead of treating every billing interaction as equally problematic.
For example, customers may tolerate a billing question but react much more negatively to an incorrect recurring charge or delayed refund.
Transfers and Escalations
Being transferred between departments can increase customer effort.
However, escalation itself should not automatically be considered negative. Some escalated conversations end successfully.
The important question is whether particular escalation patterns consistently correlate with negative sentiment. If customers transferred three or more times show significantly worse sentiment than customers transferred once, the routing process may need attention.
Product or Service Failures
Tags connected with outages, technical failures, missing functionality, damaged products, delivery problems, or recurring bugs can help product teams understand which issues have the greatest effect on customer perception.
This transforms customer support data into useful product intelligence.
Correlation Does Not Always Mean Causation
One of the most important considerations in sentiment tag analysis is that an association does not automatically prove that one factor caused the sentiment.
For example, conversations tagged “escalation” might show high negative sentiment. This does not necessarily mean escalation created the dissatisfaction.
Customers may have already been frustrated before the escalation occurred.
Similarly, conversations involving refunds might correlate with negative sentiment because customers request refunds after experiencing another problem.
For this reason, businesses should combine correlation analysis with additional context such as conversation sequences, timestamps, customer journey data, resolution outcomes, and qualitative conversation reviews.
The goal is not simply to identify correlated tags. It is to understand the customer experience behind the relationship.
Analyze Tag Combinations, Not Just Individual Tags
Customer dissatisfaction is often created by several problems occurring together.
A single technical issue may not produce particularly negative sentiment. But the combination of:
Technical issue + long hold time + repeat contact
could have a much stronger relationship with dissatisfaction.
Similarly:
Technical issue + knowledgeable agent + first-contact resolution
could result in neutral or even positive final sentiment.
Analyzing tag combinations allows teams to identify these interaction patterns.
This becomes especially valuable for large customer service operations where thousands of conversations make manual pattern discovery difficult.
Track Sentiment Changes During the Customer Journey
A single sentiment label does not always tell the complete story.
Consider two conversations that both end with positive sentiment.
In the first conversation, the customer was positive from beginning to end.
In the second, the customer started frustrated but became positive after the agent resolved the issue.
The second interaction provides important information about what caused the sentiment improvement.
Organizations can therefore analyze:
Opening sentiment → interaction tags → closing sentiment
For example:
Negative sentiment → billing dispute → clear explanation → refund processed → positive sentiment
Patterns like this help identify the actions most capable of recovering unhappy customers.
Segment Sentiment Correlation Data
Company-wide averages can hide important differences between customer groups.
For better insights, sentiment-tag correlations should be segmented by factors such as:
Customer Segment
New customers may respond differently to certain issues than long-term or high-value customers.
Communication Channel
A delay that customers tolerate over email may produce much stronger negative sentiment during live chat or phone support.
Product or Service
Different products may generate completely different sentiment drivers.
Agent or Team
Analyzing associations across teams can help identify coaching opportunities and successful behaviors worth replicating.
Customer Journey Stage
The same issue may have a different impact depending on whether it occurs during onboarding, purchasing, support, renewal, or cancellation.
Segmentation makes correlation analysis far more useful for operational decision-making.
Turning Sentiment Correlations Into Customer Experience Improvements
Correlation data becomes valuable when teams connect findings to specific actions.
A useful process is:
Identify association → validate the pattern → determine the root cause → prioritize the issue → implement changes → measure sentiment again
For example, analysis might show:
Tag: Repeat contact
Negative sentiment association: High
Conversation volume: High
That combination makes repeat contacts a strong improvement opportunity.
The company could investigate why customers are returning, improve agent knowledge, change escalation procedures, expand access to customer history, or fix recurring product problems.
After making changes, the same sentiment correlation analysis can determine whether negative associations have decreased.
Use Correlation Strength and Conversation Volume Together
Correlation strength should never be viewed in isolation.
A tag may have an extremely strong relationship with negative sentiment but appear in only a few customer conversations. Another tag might have a slightly weaker negative association but affect thousands of customers every month.
The second issue may deserve higher priority.
A practical prioritization model considers:
Association strength × conversation frequency × business impact
This helps teams distinguish between interesting insights and high-impact customer experience problems.
For example:
| Issue | Negative Association | Monthly Volume | Priority |
|---|---|---|---|
| Account verification failure | Very high | 120 | Medium |
| Long wait time | High | 8,400 | Very high |
| Missing invoice | Moderate | 2,700 | High |
The result is a more realistic improvement roadmap.
How AI Improves Customer Sentiment Tag Correlation Analysis
Manual sentiment and tagging analysis becomes difficult when an organization handles thousands or millions of customer interactions.
AI can automate much of the process by analyzing conversations at scale.
Modern AI-powered customer intelligence systems can:
- Automatically classify customer sentiment
- Detect conversation topics
- Apply multiple tags to the same interaction
- Discover emerging topics that were not previously tagged
- Track sentiment changes throughout conversations
- Identify recurring tag combinations
- Compare sentiment patterns across channels
- Surface unusual increases in negative associations
- Summarize the conversations behind a trend
Instead of manually reviewing a small sample of customer interactions, CX teams can analyze a much larger percentage of their customer conversations.
Human review is still important. Teams should regularly inspect representative conversations behind important correlations to verify that the AI interpretation matches the actual customer experience.
Key Metrics to Track
A useful customer sentiment correlation dashboard should go beyond basic positive and negative percentages.
Important metrics can include:
- Positive sentiment rate: Percentage of conversations containing a tag that have positive sentiment.
- Negative sentiment rate: Percentage associated with negative sentiment.
- Tag frequency: Number or percentage of conversations containing the tag.
- Sentiment change: Difference between customer sentiment at the beginning and end of an interaction.
- Repeat-contact rate: Whether conversations involving the tag lead to another customer contact.
- Resolution rate: Percentage of tagged conversations that result in successful resolution.
- Escalation rate: How frequently the issue requires additional support.
- Trend over time: Whether the positive or negative relationship is becoming stronger or weaker.
Together, these metrics provide much more context than a standalone sentiment score.
Best Practices for Reliable Sentiment Tag Correlation Analysis
To make the analysis genuinely useful, organizations should maintain consistent tagging rules and clearly define what each sentiment category represents.
Avoid creating hundreds of overlapping tags because fragmented tagging makes meaningful patterns harder to detect. Tags such as “waiting,” “long waiting,” “customer waited,” and “hold problem” may need to be consolidated into a consistent taxonomy.
Teams should also analyze a sufficiently large dataset. Small conversation samples can create misleading associations, especially when a tag appears infrequently.
Most importantly, review the conversations behind major findings. Statistical associations can point teams toward a problem, but listening to or reading actual customer interactions explains why the relationship exists.
From Sentiment Scores to Actionable Customer Intelligence
Customer sentiment becomes significantly more useful when businesses connect emotions with the topics, events, and outcomes surrounding them.
Customer sentiment tag correlation analysis makes that connection visible.
Instead of simply reporting that customer sentiment is improving or declining, teams can identify which experiences are driving the change, which issues create the strongest negative associations, which behaviors produce positive outcomes, and where improvements will affect the largest number of customers.
That turns sentiment analysis from a reporting metric into a practical system for improving customer experience, agent performance, products, and operational processes.
How Automated Analytics Simplifies Sentiment Tag Correlation
Automated analytics transform this workflow from months to minutes. In the past, I watched teams spend days exporting, cleaning, and crunching data, only to struggle presenting findings. Now, platforms like Commplify’s Analytics & Reporting modules do the heavy lifting.
- Real-time dashboards showing sentiment breakdowns and their statistical links to CSAT, escalation rates, or agent performance.
- Prebuilt correlation visualizations and trend reports—zero manual downloads.
- Automated triggers: for example, auto-routing of conversations flagged with “angry” sentiment and high escalation correlation to senior agents.
This is not about removing the analyst. It’s about making evidence-based actions part of daily operations and freeing CX leaders to focus on improvement, not data wrangling.
Conclusion
Customer sentiment tag correlation analysis is the missing link between customer voice and business outcomes. It’s how modern CX teams replace gut feel with clear evidence about what drives satisfaction or frustration.
Platforms with robust Analytics & Reporting, such as Commplify, do more than automate the math. They surface the hidden patterns, so your team spends less time wrangling spreadsheets and more time closing real experience gaps. When you unify tagging and analytics across channels, it’s finally possible to move the needle on CSAT and escalations using data that everyone trusts.
The future of customer experience lies in making every customer emotion visible, quantifiable, and actionable—no matter the channel. This is where AI can serve as your team’s extra pair of eyes, always connecting feedback to outcomes.
FAQs
What are sentiment tags in customer feedback?
Sentiment tags label a customer’s emotional tone—such as positive, negative, or neutral—assigned to messages in chats, emails, calls, or texts.
How do you analyze the correlation between sentiment tags?
Export tagged data, standardize it, then use correlation methods (like Pearson or Spearman) to quantify the statistical link between sentiment and outcomes.
What does a positive or negative association mean in sentiment data?
A positive association means positive sentiment tags increase with a good outcome (like CSAT). Negative association means negative tags rise with poor outcomes (like escalations).
Which tools or platforms support sentiment tag correlation analysis?
Modern CX analytics platforms, such as Commplify, offer real-time dashboards, tagging, and automated correlation insights across channels.
How can sentiment tag correlation insights be used to improve customer service or CX?
They reveal root causes of satisfaction or frustration, enabling targeted training, workflow changes, and proactive escalations to improve results.
What are the limitations or risks of relying on sentiment correlation analysis?
Correlation does not prove causation. Data quality, tagging accuracy, channel bias, and ethical concerns about privacy and bias are key risks to watch.
Is automated sentiment tagging as reliable as manual tagging?
Advanced AI models now approach or exceed manual accuracy in most use cases, but regular validation and calibration remain critical.
How can I visualize customer sentiment correlations effectively?
Use dashboards, scatterplots, heatmaps, and correlation matrices to display strength and direction of sentiment-outcome relationships in a clear, accessible format.
This page was last edited on 10 August 2026, at 6:06 am