
To forecast revenue using customer sentiment analysis, combine real-time sentiment data from all customer touchpoints with your CRM pipeline. Map positive or negative signals to account health to spot churn, upsell, or renewal triggers missed by past-only data.
Accurate revenue forecasting holds more risk than most admit. Leaders under pressure often rely on pipeline data they know is missing key signals—like brewing customer frustration or hidden upsell intent.
I have seen even high-performing teams blindsided by churn or missed a renewal because the emotion in support emails or call transcripts never made it into the forecast. The real issue is traditional CRM and pipeline numbers lack a human touch.
This guide will show you, step by step, how to forecast revenue using customer sentiment analysis. You will learn a practical workflow to turn every chat, call, or ticket into actionable insight for CX, sales, and revenue teams.
How to Forecast Revenue Using Customer Sentiment Analysis
Customer sentiment analysis can become a useful revenue forecasting signal when it is connected with actual customer behavior. Instead of looking only at historical sales, pipeline value, or seasonal patterns, businesses can analyze how customers feel about their products, services, support experiences, and brand—and then measure whether those feelings are associated with purchases, renewals, cancellations, upgrades, or reduced spending.
The goal is not to predict revenue directly from a positive or negative comment. The stronger approach is to combine sentiment data with operational and financial metrics so that changing customer attitudes can act as an early indicator of future revenue movement.
For example, a noticeable decline in sentiment among subscription customers may appear several weeks before an increase in cancellations. A rise in positive sentiment following a product release may be followed by stronger retention, upgrades, referrals, or repeat purchases.
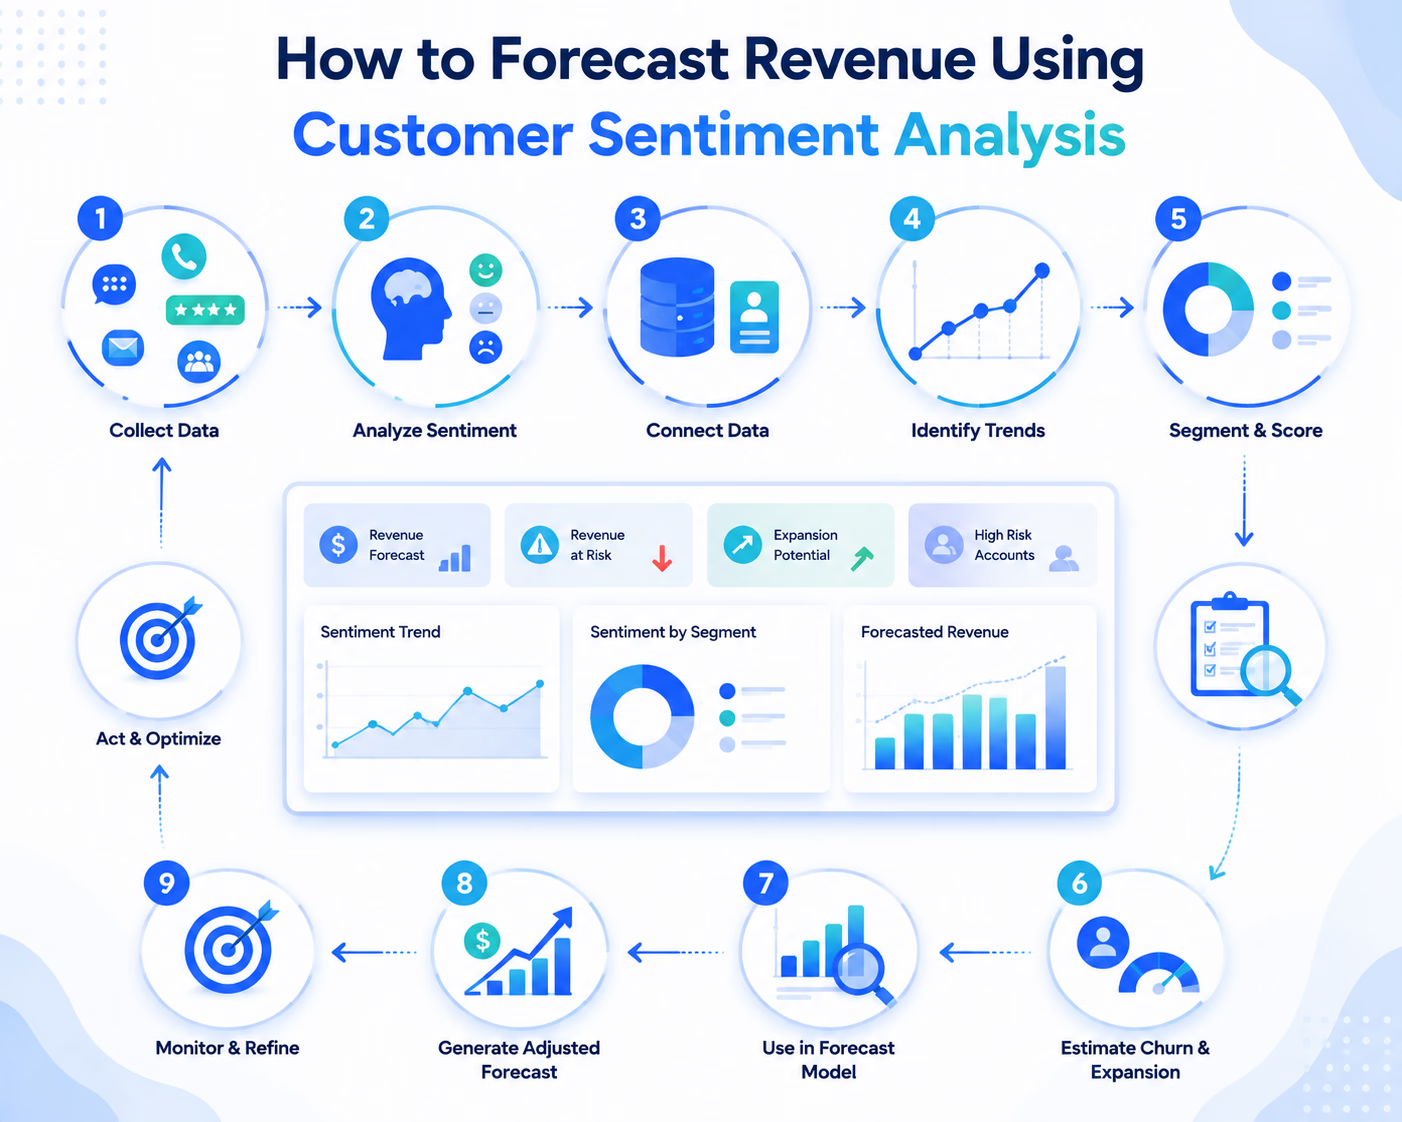
1. Collect Customer Sentiment From Revenue-Relevant Touchpoints
Start by collecting customer feedback from channels that are closely connected to the buying and retention journey.
Useful sentiment sources include:
- Customer service calls
- Live chat conversations
- Support tickets
- Emails
- Customer surveys
- Product reviews
- Social media comments
- NPS and CSAT responses
- Sales conversations
- Renewal conversations
- App or website feedback
Not every source should receive the same importance.
For revenue forecasting, a complaint made during a renewal conversation is usually more significant than a general negative social media comment. Similarly, sentiment expressed by a high-value customer may have a larger potential revenue impact than feedback from someone who has never purchased.
Businesses should therefore attach customer identity, account value, subscription status, transaction history, customer lifecycle stage, and other relevant information whenever possible.
This turns sentiment from isolated feedback into measurable customer intelligence.
2. Convert Customer Conversations Into Sentiment Scores
Once the data is collected, sentiment analysis models can classify customer language into categories such as:
- Positive
- Neutral
- Negative
More advanced systems can assign numerical scores, such as:
-1.0 = strongly negative
0 = neutral
+1.0 = strongly positive
However, basic positive-versus-negative classification often misses important context.
Revenue-focused sentiment analysis should ideally identify emotions and intentions such as:
- Satisfaction
- Frustration
- Excitement
- Disappointment
- Trust
- Confusion
- Purchase intent
- Cancellation intent
- Upgrade interest
- Price sensitivity
Consider two customers who both receive a negative sentiment score.
One says they found a product feature difficult to use. Another says they are considering cancelling their subscription because repeated support issues have not been resolved.
Both conversations are negative, but their potential revenue impact is very different.
For forecasting purposes, sentiment should therefore be evaluated alongside customer intent and business context.
3. Connect Sentiment Data With Historical Revenue
Sentiment becomes useful for forecasting when businesses determine how historical sentiment changes relate to actual financial outcomes.
For example, analyze whether customers with increasingly negative sentiment are more likely to:
- Cancel subscriptions
- Reduce purchases
- Request refunds
- Downgrade plans
- Delay renewals
- Stop engaging with sales teams
Then analyze whether customers with positive sentiment are more likely to:
- Renew subscriptions
- Make repeat purchases
- Upgrade plans
- Buy additional products
- Refer new customers
- Accept sales offers
Suppose historical analysis shows that customers with highly positive sentiment have an average renewal rate of 92%, while accounts showing sustained negative sentiment renew only 58% of the time.
That difference can be incorporated into future revenue projections instead of assuming every account has the same probability of renewing.
Example
Imagine a SaaS company has $500,000 in annual recurring revenue approaching renewal.
The company segments the accounts based on recent customer sentiment:
| Customer Segment | Revenue at Renewal | Expected Renewal Rate | Forecast Revenue |
|---|---|---|---|
| Positive sentiment | $250,000 | 92% | $230,000 |
| Neutral sentiment | $150,000 | 80% | $120,000 |
| Negative sentiment | $100,000 | 55% | $55,000 |
The sentiment-adjusted revenue forecast becomes:
$230,000 + $120,000 + $55,000 = $405,000
Without sentiment analysis, the business might simply apply an overall historical renewal rate and miss emerging customer dissatisfaction.
The forecast is therefore more sensitive to what is currently happening within the customer base.
4. Identify Sentiment Trends Instead of Looking at One Conversation
Individual conversations can be misleading.
A loyal customer may become frustrated during one support interaction but remain highly satisfied overall. Another customer may sound neutral in individual conversations while their sentiment gradually becomes more negative over several months.
Revenue forecasting should therefore focus heavily on sentiment trends.
Track metrics such as:
- Average sentiment over time
- Percentage of negative conversations
- Change in sentiment during the last 30, 60, or 90 days
- Sentiment after support cases
- Sentiment before renewal
- Sentiment after product releases
- Sentiment before and after purchases
- Number of unresolved negative interactions
A useful metric is sentiment velocity, which measures how quickly customer sentiment is improving or deteriorating.
For example:
Sentiment velocity = Current sentiment score − Previous sentiment score
If an account’s average score falls from +0.55 to -0.20, the change is:
-0.20 − 0.55 = -0.75
That decline may deserve more attention than an account that has remained moderately negative for months but continues to renew consistently.
Tracking direction and magnitude helps forecasting models recognize emerging revenue risks earlier.
5. Create Sentiment-Based Revenue Risk Scores
Businesses can combine sentiment with customer behavior to calculate a revenue risk score for each customer or account.
A model might consider:
Revenue Risk Score = Sentiment + Usage + Support Issues + Purchase Behavior + Renewal Proximity
The precise weighting should be determined using historical company data.
For example:
| Factor | Example Weight |
|---|---|
| Recent sentiment | 30% |
| Product usage | 25% |
| Support activity | 15% |
| Payment/purchase behavior | 15% |
| Renewal proximity | 15% |
A high-value customer showing declining product usage, multiple support complaints, and increasingly negative sentiment would receive a much higher revenue-risk score than a customer who simply left one negative review.
Accounts can then be categorized as:
Low risk: Healthy sentiment and behavior
Moderate risk: Some warning signals
High risk: Strong indicators of churn or reduced spending
Revenue teams can use these probabilities when calculating expected recurring revenue.
6. Estimate Churn and Renewal Revenue From Sentiment
One of the clearest applications of sentiment-based forecasting is predicting revenue at risk from customer churn.
Instead of assuming that every customer has the same churn probability, businesses can calculate account-specific probabilities.
A simplified forecast can use:
Expected Renewal Revenue = Contract Value × Probability of Renewal
If a customer has a $20,000 annual contract and the model estimates an 85% renewal probability:
$20,000 × 0.85 = $17,000 expected renewal revenue
Now consider another $20,000 account showing rapidly declining sentiment, falling product usage, and repeated unresolved complaints. If its estimated renewal probability drops to 45%:
$20,000 × 0.45 = $9,000 expected renewal revenue
Applying this calculation across the customer portfolio produces a more realistic revenue forecast than treating the entire renewal pipeline equally.
7. Use Positive Sentiment to Forecast Expansion Revenue
Sentiment analysis should not be used only to detect churn.
Positive customer signals can also reveal potential revenue expansion.
Customers consistently expressing satisfaction or excitement may have a higher likelihood of:
- Upgrading subscriptions
- Purchasing additional licenses
- Adding new features
- Buying complementary products
- Increasing order frequency
- Accepting cross-sell offers
A business can identify accounts with strong positive sentiment and combine that information with product usage and purchase history to estimate expansion opportunities.
For example, a customer displaying:
High satisfaction + increasing usage + approaching plan limits
may be significantly more likely to upgrade than a customer whose usage remains low.
Sales teams can use these signals to prioritize accounts instead of targeting every customer equally.
8. Include Customer Sentiment in Predictive Revenue Models
Sentiment data works best when it becomes one variable inside a broader predictive forecasting model.
Typical forecasting inputs can include:
Historical factors
- Previous revenue
- Purchase frequency
- Average order value
- Contract value
- Renewal history
Behavioral factors
- Product usage
- Website engagement
- Feature adoption
- Support activity
Customer sentiment factors
- Average sentiment
- Sentiment trend
- Frequency of negative interactions
- Customer emotions
- Purchase or cancellation intent
Business factors
- Seasonality
- Pricing changes
- Promotions
- Customer segment
- Market conditions
Machine learning models can then analyze relationships between these variables and historical revenue outcomes.
As additional customer interactions and revenue outcomes become available, the forecasting model can be periodically retrained to improve its predictions.
9. Build a Sentiment-Adjusted Revenue Forecast
Once sentiment probabilities have been developed, they can be incorporated into existing revenue forecasting processes.
A basic framework is:
Forecast Revenue = Existing Revenue × Retention Probability + Expected Expansion Revenue + Expected New Revenue
Customer sentiment primarily improves the estimation of retention and expansion probabilities.
For example:
- Existing recurring revenue: $1,000,000
- Sentiment-adjusted retention probability: 88%
- Expected expansion revenue: $130,000
- Expected new customer revenue: $250,000
The forecast becomes:
($1,000,000 × 88%) + $130,000 + $250,000
= $1,260,000 forecast revenue
The important difference is that the 88% retention estimate can continually change as customer conversations and behavior change.
If widespread negative sentiment develops after a pricing change or product issue, the forecast can be adjusted before the impact appears in finalized churn numbers.
10. Monitor Revenue Forecast Signals in Real Time
Sentiment-based forecasting becomes particularly valuable when customer conversations are analyzed continuously.
A revenue or customer intelligence dashboard can track:
- Overall customer sentiment
- Sentiment by customer segment
- Revenue associated with negative sentiment
- High-value accounts experiencing sentiment decline
- Sentiment-based churn probability
- Renewal revenue at risk
- Potential expansion revenue
- Changes in forecasted revenue
For example, instead of displaying only:
Forecast revenue: $4.2 million
a more actionable dashboard might show:
Base forecast: $4.2 million
Revenue at elevated churn risk: $340,000
Potential expansion revenue: $180,000
Accounts with worsening sentiment: 27
This gives revenue teams insight into both the expected result and the customer signals affecting that forecast.
Which Customer Sentiment Metrics Matter Most for Revenue Forecasting?
Not every sentiment metric provides the same forecasting value. Businesses should prioritize metrics that can be connected with measurable revenue outcomes.
Important metrics include:
Average Sentiment Score
Measures overall customer attitude across conversations during a defined period.
Negative Sentiment Rate
Shows the percentage of customer interactions classified as negative.
Negative Sentiment Rate = Negative Interactions ÷ Total Interactions × 100
Sentiment Trend
Measures whether customer sentiment is improving or deteriorating over time.
Sentiment by Customer Value
Separates sentiment among high-value, mid-value, and lower-value customers so revenue teams can understand the financial significance of dissatisfaction.
Revenue at Risk
Measures how much revenue belongs to customers showing strong churn indicators.
Revenue at Risk = Customer Revenue × Estimated Churn Probability
Sentiment-to-Renewal Correlation
Measures whether sentiment scores historically correspond with renewal outcomes.
Sentiment-to-Purchase Correlation
Evaluates whether improving customer sentiment is associated with higher purchase frequency, order value, upgrades, or additional sales.
Example: Revenue Forecasting Using Customer Sentiment
Consider a subscription company with 1,000 customers generating $5 million in annual recurring revenue.
Traditional forecasting suggests approximately 90% of that revenue will renew.
However, customer conversation analysis detects worsening sentiment among several important accounts representing $800,000 in ARR.
Historical data shows that customers displaying similar patterns renewed only 60% of the time.
Instead of forecasting:
$800,000 × 90% = $720,000
the company adjusts the forecast for these accounts:
$800,000 × 60% = $480,000
That represents a potential difference of:
$240,000
The business can now investigate those accounts, resolve service problems, improve the customer experience, or provide targeted retention support before contracts expire.
This is where sentiment analysis provides the greatest forecasting value: it does not simply explain how customers feel. It can reveal financial risks and opportunities early enough for the business to respond.
Customer Sentiment Should Complement, Not Replace, Revenue Data
Customer sentiment analysis should not replace established financial forecasting methods.
Sentiment can be affected by temporary frustration, unusual events, sarcasm, incomplete context, or differences in how customers communicate. Forecasts based only on sentiment can therefore produce misleading results.
More reliable forecasting combines:
Customer sentiment + customer behavior + historical revenue + transaction data + business context
When those signals are analyzed together, businesses gain a more complete view of future revenue.
Historical financial data explains what normally happens. Customer sentiment can help reveal whether customer behavior may be starting to change.
That makes sentiment analysis especially useful as an early-warning layer within a broader revenue forecasting system.
Enabling Unified Revenue Forecasting with Commplify
Conversation Management is where sentiment scoring meets true business value. Platforms like Commplify excel here. In my POV, pulling all chat, call, SMS, email, and WhatsApp threads into one inbox finally makes real-time sentiment aggregation and account-level scoring possible.
With workflow automation built in, teams can trigger instant CSM outreach, sales alerts, or retention offers when negative signals pop. Analytics dashboards track every sentiment-driven play—so you can measure saved accounts or new revenue in concrete numbers.
This unified approach removes manual handoff and slow escalation. The result: more actionable forecasts and faster reaction to real risk or revenue upside.
Conclusion
Forecasting revenue using customer sentiment analysis delivers a practical edge over pipeline-only approaches. By turning conversation signals into data, businesses get an early warning on churn, see expansion openings, and close more renewals.
In my experience, the teams that win here are the ones who unify their conversation data, tag key revenue signals, and automate follow-up with workflow triggers. Platform capabilities like Commplify’s Conversation Management and Workflow Automation help—but the real advance is building a CX culture that acts on every emotional cue.
Start small if you need to. Choose one key segment, bring sentiment into your model, and track improvement. Revenue agility comes from knowing what your customers feel before your pipeline shows the pain.
AI-driven CX is moving quickly. Those who integrate sentiment now will build forecasts—and customer relationships—that last.
FAQs
How can customer sentiment analysis improve revenue forecasting?
Sentiment analysis adds real-time emotion and intent signals from all customer interactions, revealing early churn or upsell risks that pure CRM or pipeline data cannot spot.
What are the best data sources for sentiment-driven forecasting?
The best sources are chat logs, call transcripts, email threads, SMS, WhatsApp messages, and support tickets—pulled together for each account.
How do you operationalize sentiment data in a sales pipeline or CRM?
First, classify sentiment in each interaction. Map signals to account health and link them to pipeline records. Use workflow automation for real-time alerts and actions.
Can sentiment analysis really help reduce churn or loss in revenue?
Yes. Early detection of negative sentiment or intent allows teams to address issues before churn. Many account saves start with a rapid response to flagged interactions.
What’s different about collecting sentiment data for B2B vs. B2C companies?
B2B sentiment analysis relies on fewer but deeper conversations per account, covers multiple stakeholders, and impacts much larger revenue deals, compared to high-volume B2C.
How accurate is sentiment-based sales forecasting?
Accuracy depends on quality and breadth of multi-channel data, continuous model tuning, and human oversight. Sentiment sharply improves early detection but is not perfect alone.
How do platforms like Commplify automate and integrate sentiment into forecasting workflows?
Commplify aggregates sentiment across all conversation channels, scores accounts in real time, and automates CSM or sales actions through customizable workflow triggers and analytics.
What challenges should businesses watch for when using sentiment analysis in revenue forecasts?
Watch for data bias, channel blind spots, overreacting to outliers, confusing intent with sentiment, and missing human-in-the-loop review to keep models sharp.
This page was last edited on 11 August 2026, at 2:31 am